Gain clear insights with our practical tools
.png)
Get the insights you need to build a foundation for improvement
Impact Scan
ESG Questionnaire
Results Dashboard
Every assessment begins with an Impact Scan, a brief set of questions about your business. This tailors the tool to your situation, so you only see what’s relevant. It saves time and gives you faster insights.

Relevant focus
Only the questions that truly apply to your business.
Time saving & faster insights
No unnecessary work, just a clear starting point to move forward quickly and efficiently.
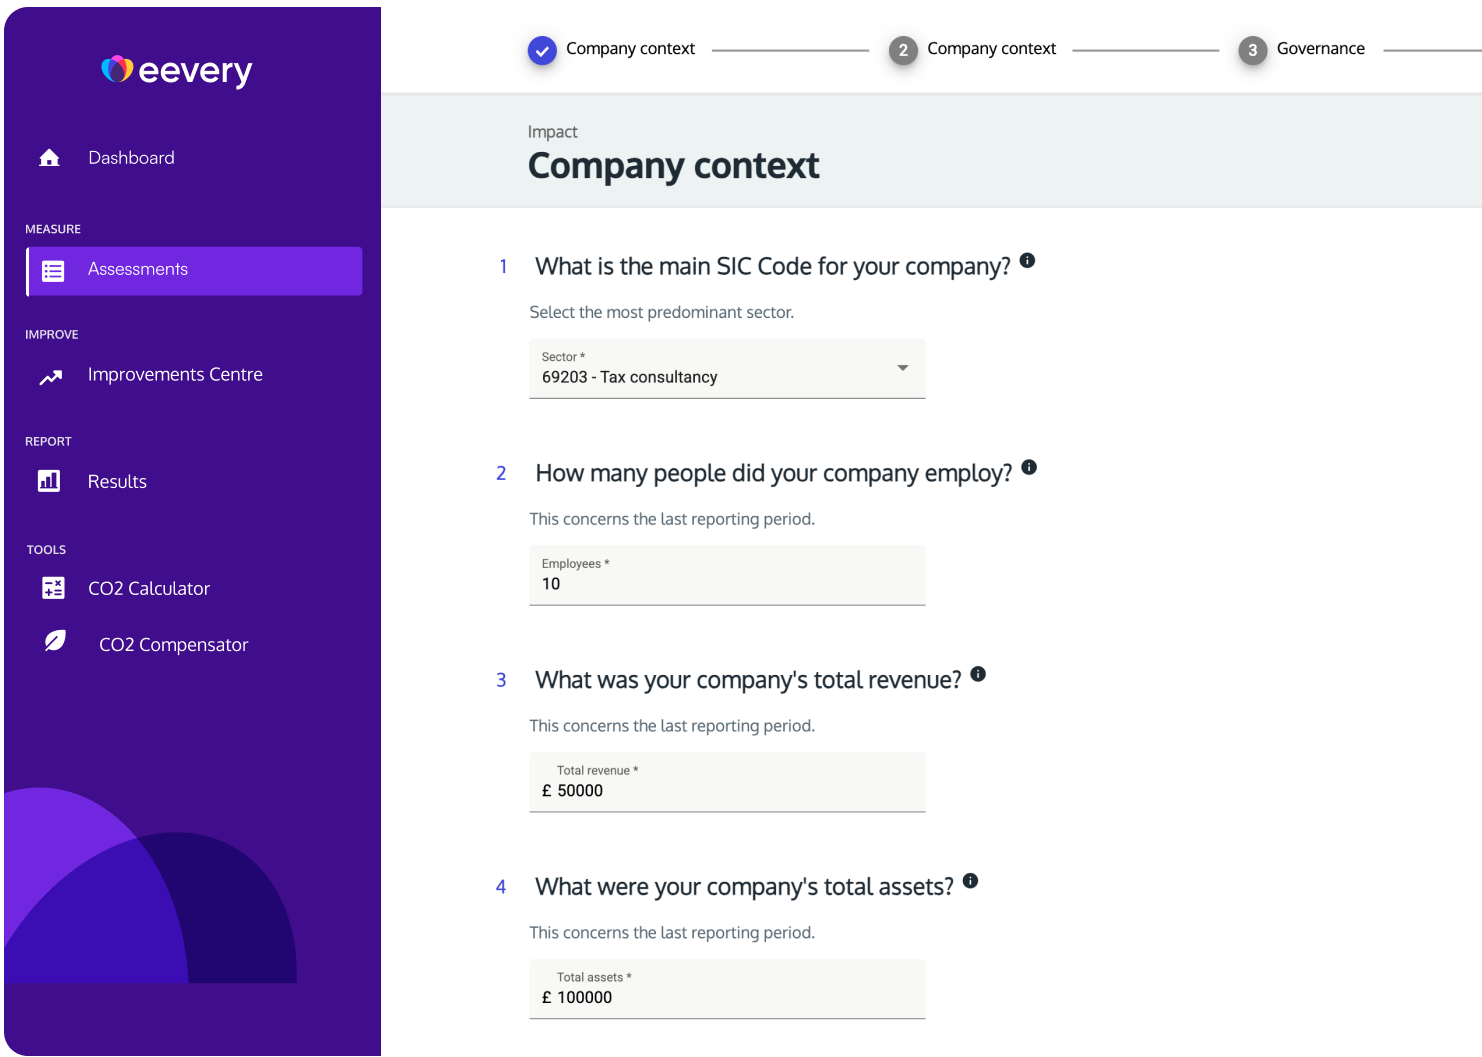
By filling the questionnaire, you get a clear picture of where you stand on all ESG themes.
Questions are automatically filtered to your business, showing only questions that are relevant for you. This makes the assessment simple and efficient.
User-friendly
A clear and straightforward design makes it easy to complete, with an 'info' button at every question that provides extra guidance when needed.
Pre-fill option
Reuse your previous answers in a new assessment to save time and effort.
Collaborative
Invite colleagues to contribute and make it a team effort.
.png)
Our dashboard brings all your results together in one place. The dashboard is aligned with international frameworks such as the SDGs, GRI, CSRD, making your results objective.
Deep insight
Understand your performance across all ESG themes and see where you can improve.
Track your progress
Compare your results with previous assessments and see how your business is moving forward.
Ready for reporting
Aligned with international standards and legislation, so you always meet the latest requirements.

.png)
.svg)
Data Collection
Data Input
Results
Dashboard
Good preparation starts with the right data. Collect all information that says something about your emissions, such as energy use, kilometres driven or costs.
Flexible input
Use the data you already have. You can enter information based on usage, costs or data from your supplier.
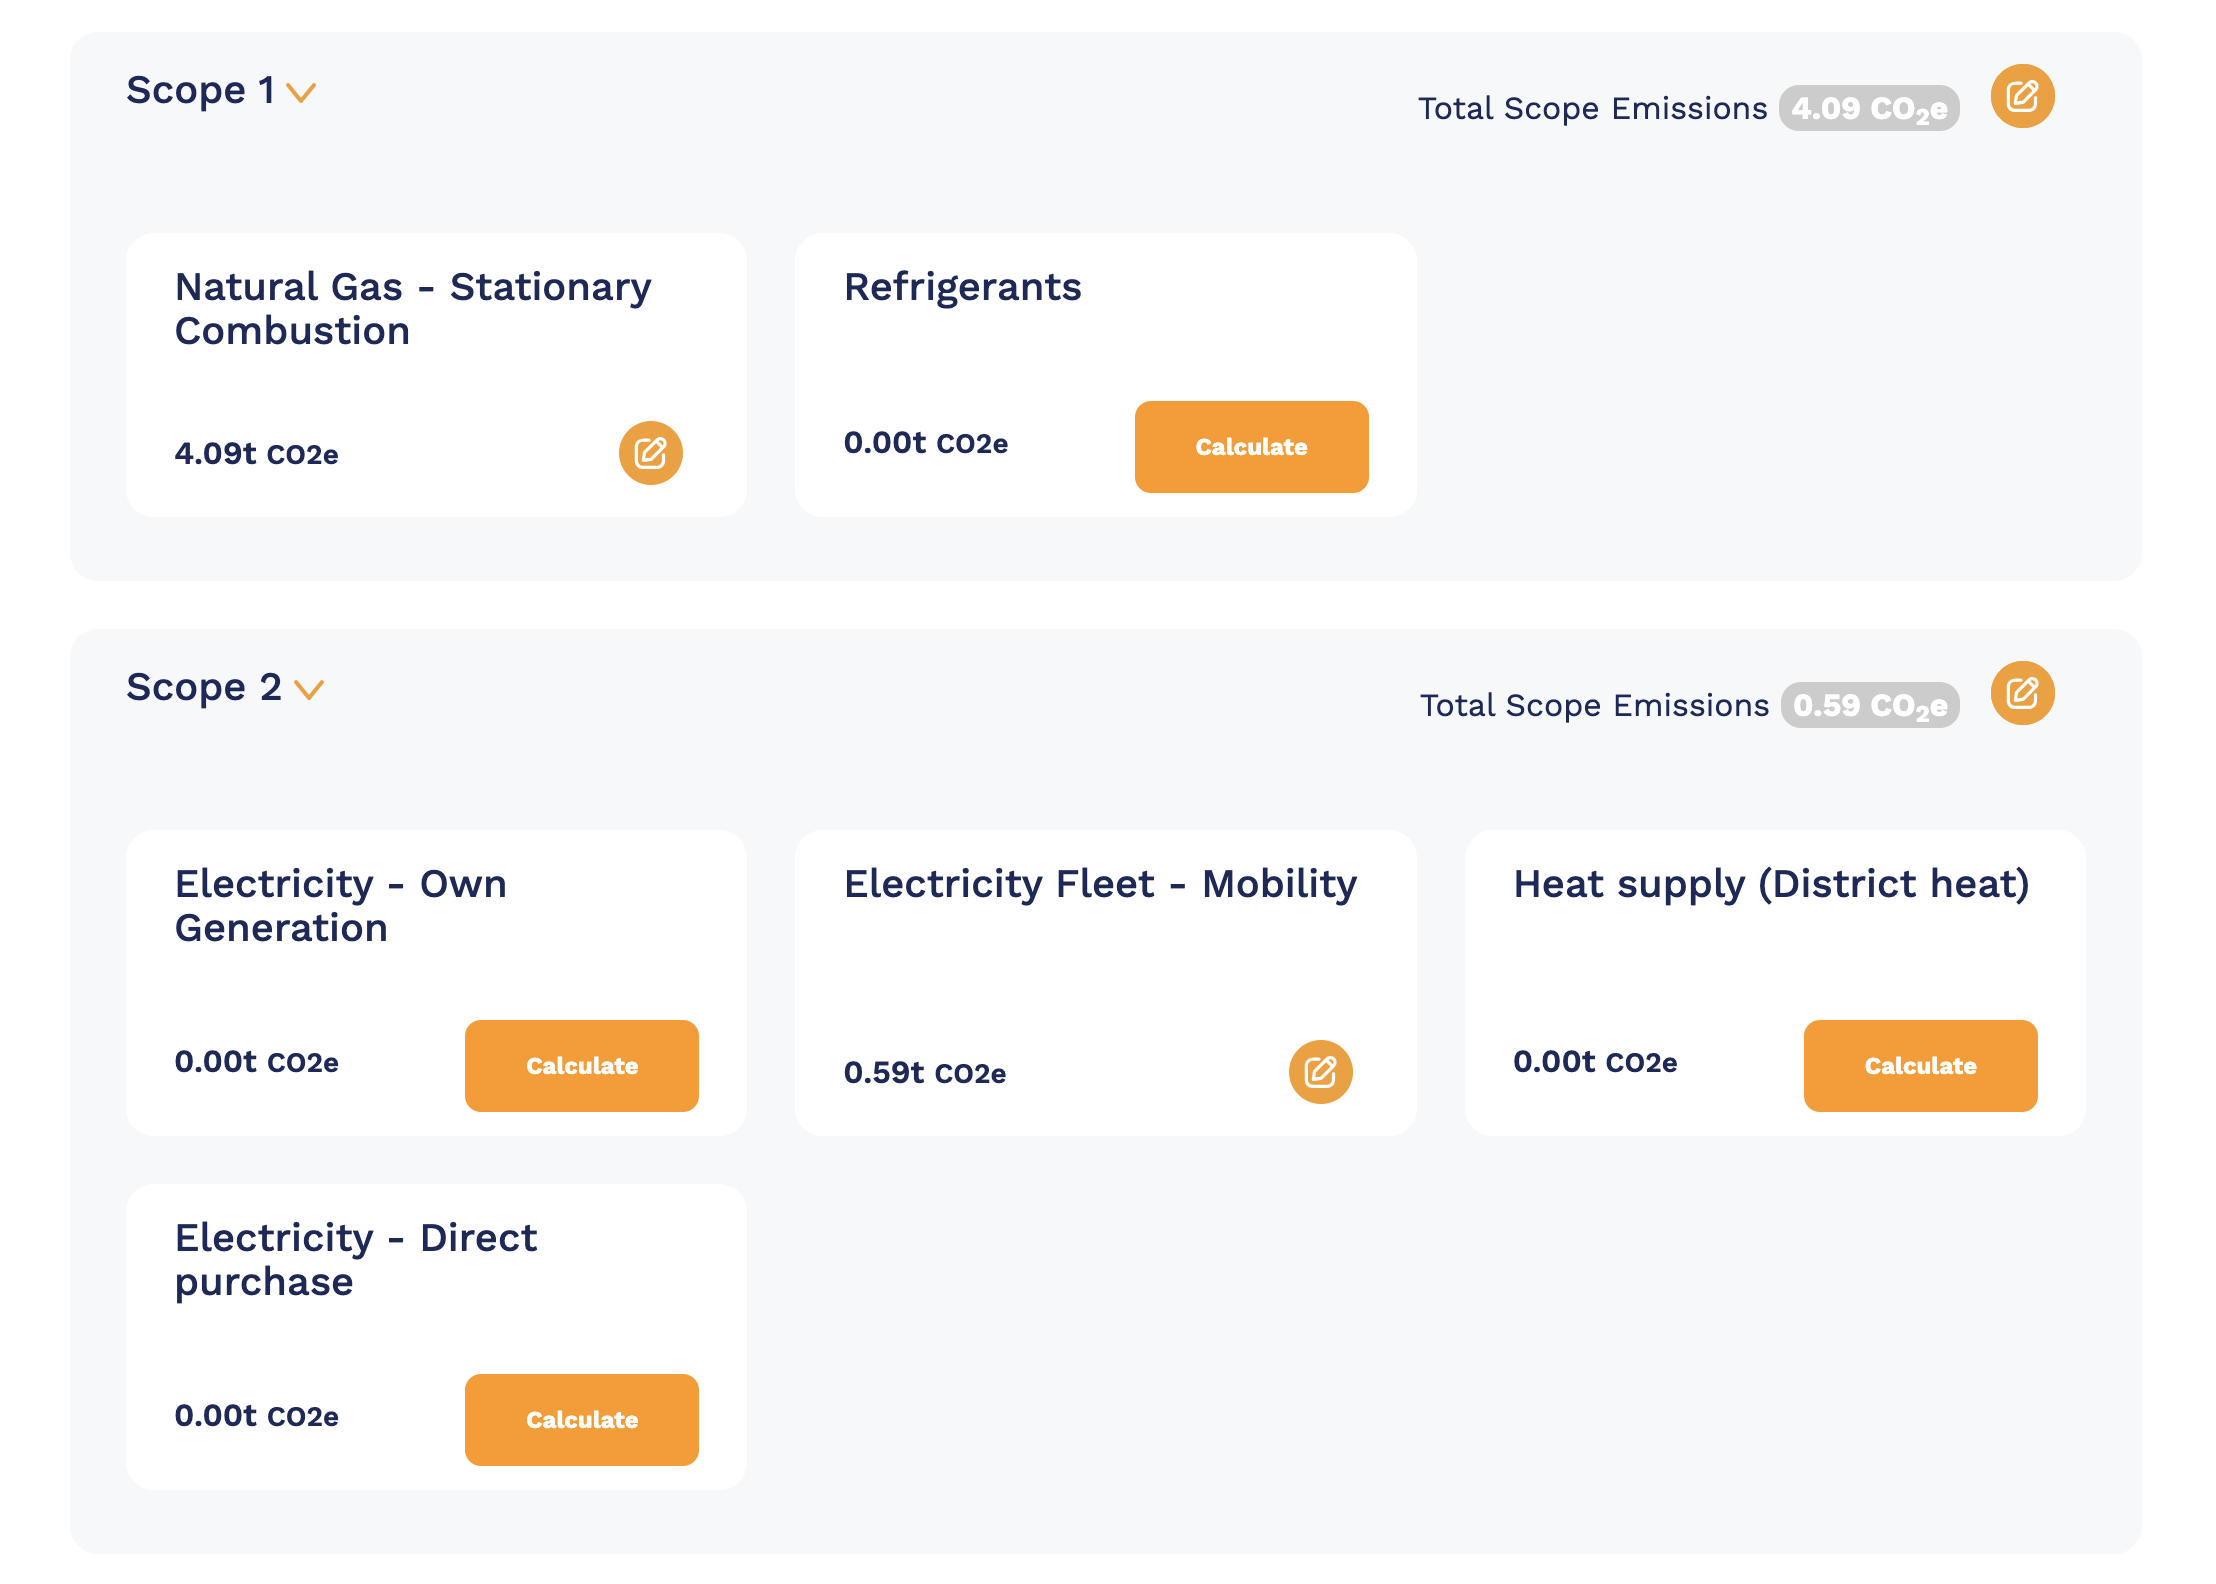
Automatic conversion and calculation
The tool automatically converts your data into CO₂ using the correct emission factors.
.svg)
Decide whether you want to enter the data yourself or leave it to us. All data is saved in real time in your own environment. This way, you never have to worry about missing information or scattered documents.
Detailed results for each location
Add multiple offices or sites and view the results for each location. This gives you a clear picture of emissions at both the local and business-wide levels.
Always accurate and up-to-date
The tool uses the correct emission factors for each country. This makes your results reliable and easy to compare internationally.
Work together seamlessly
Invite colleagues to contribute and make it a team effort.
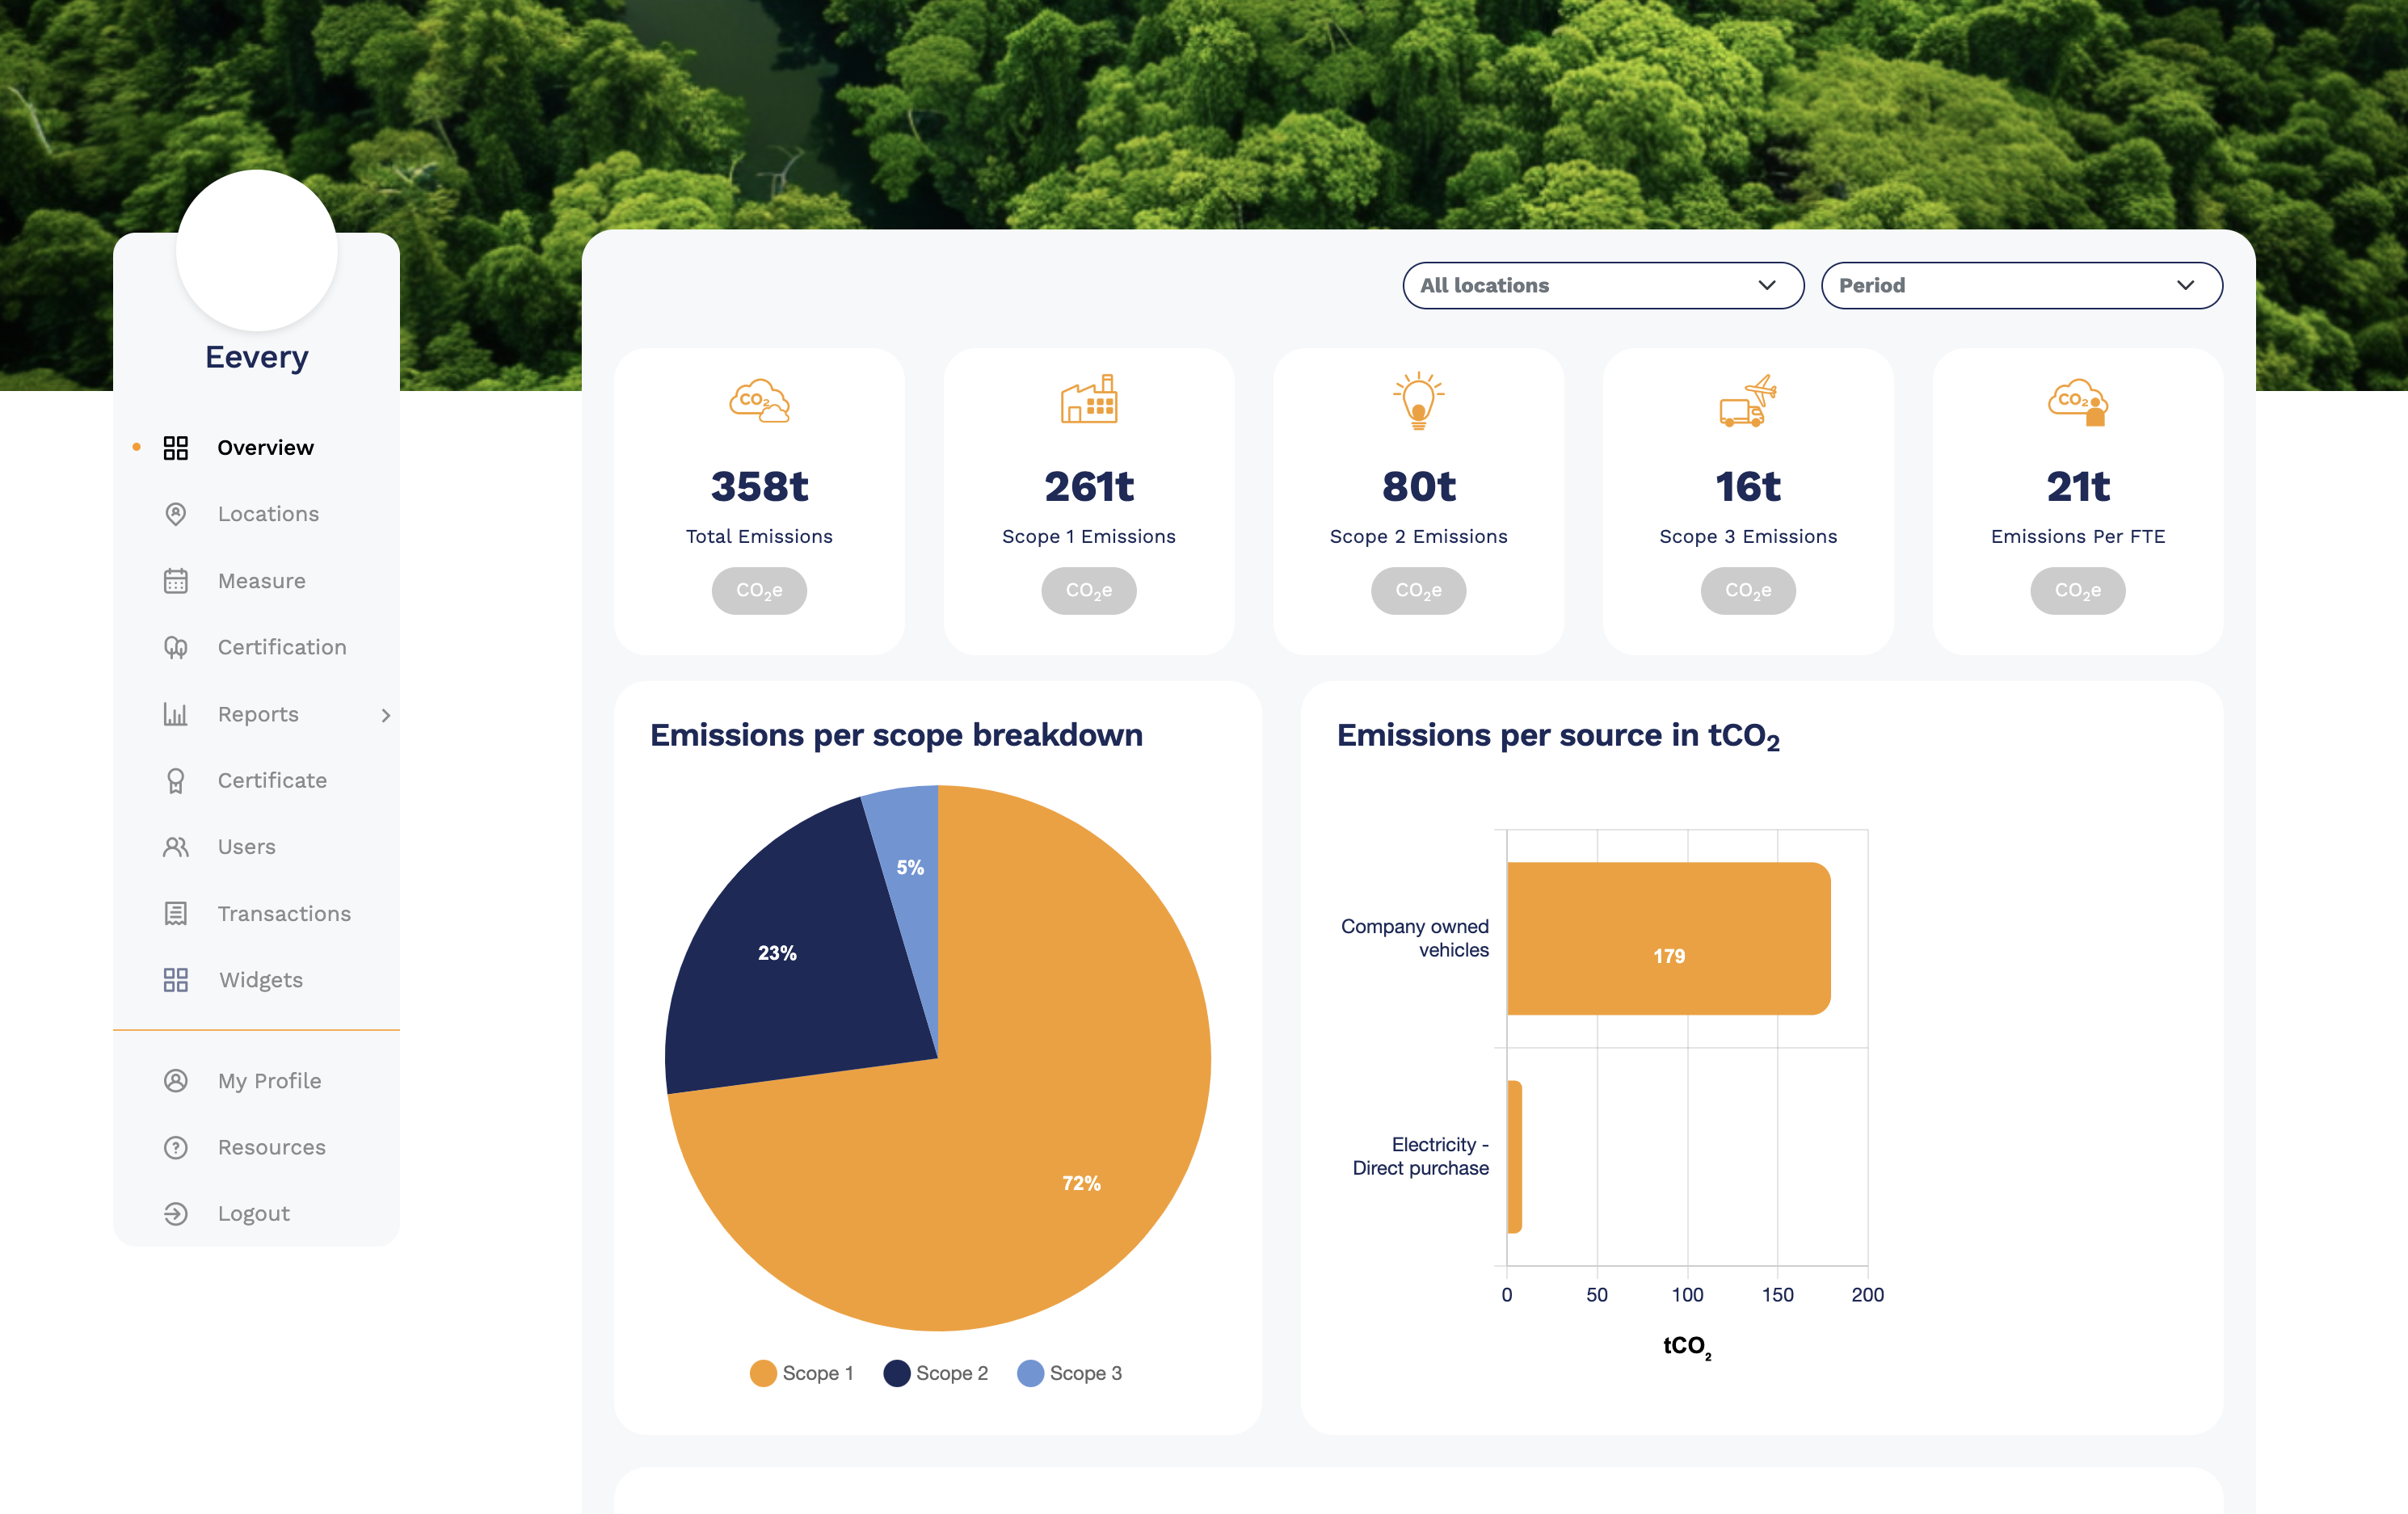
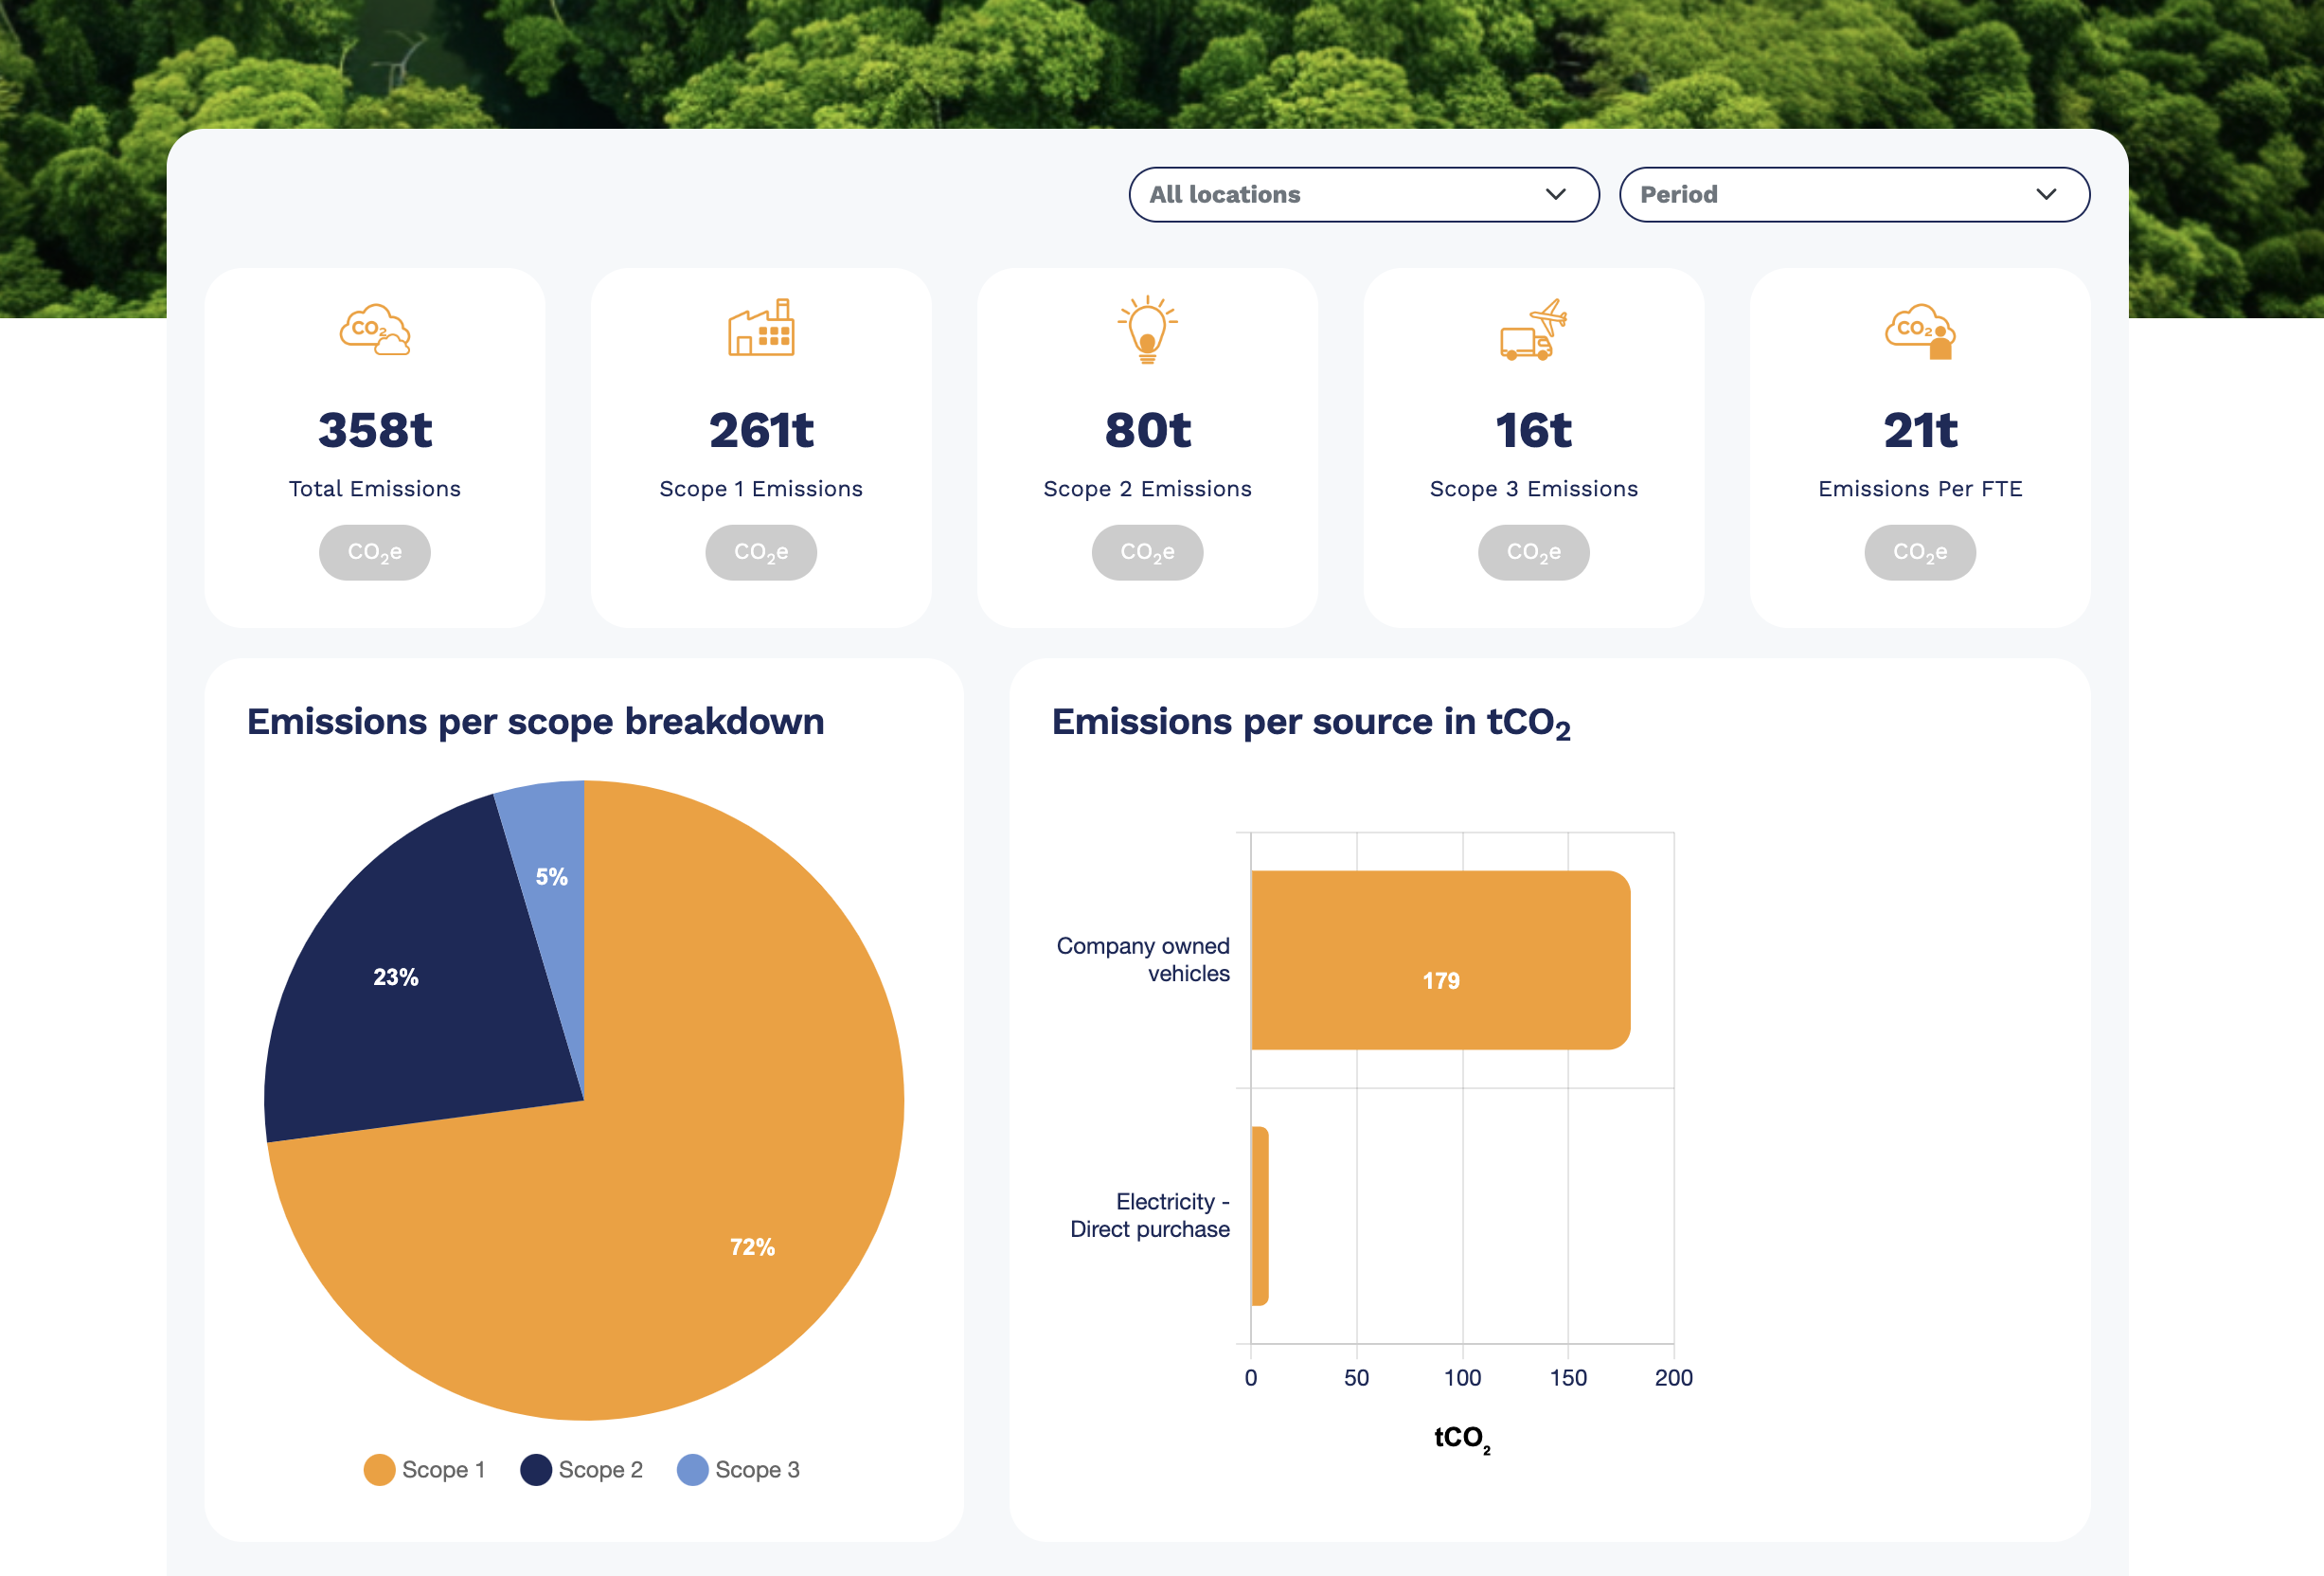
Your results come together in a clear and visual dashboard. View your emissions broken down per category and get insight into where you make the most impact.
Insight per location
Add multiple offices or sites, and view emissions per location alongside your business's total footprint.
Detailed categories
Get a clear overview of your CO₂ emissions per category for a complete picture of your impact.
Track and compare
Track your progress and compare locations, business units or even full portfolios. This shows you where you stand and where you can improve. Set your reduction goals in the tool and follow your progress each year.